This project was an analysis of the Hitchiti National Forest in Georgia, a plot of land that has been studied by the USDA for many decades. The goal of this project was to take the dataset provided by the USDA and create interactive visualization that would allow users to explore the dataset and locate trends within. This was done in R and was finalized into an RShiny app.


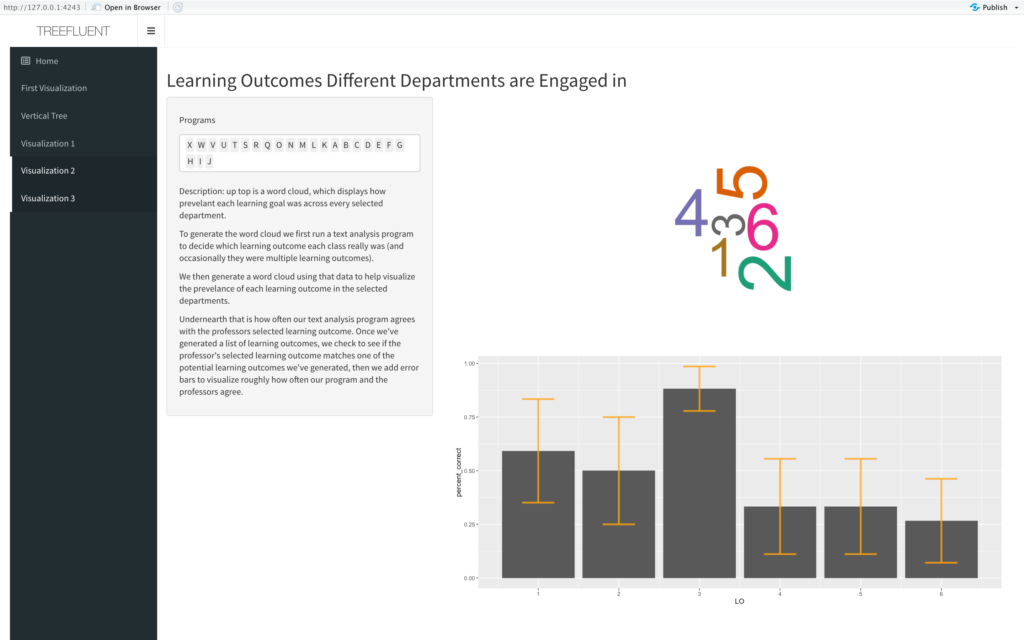
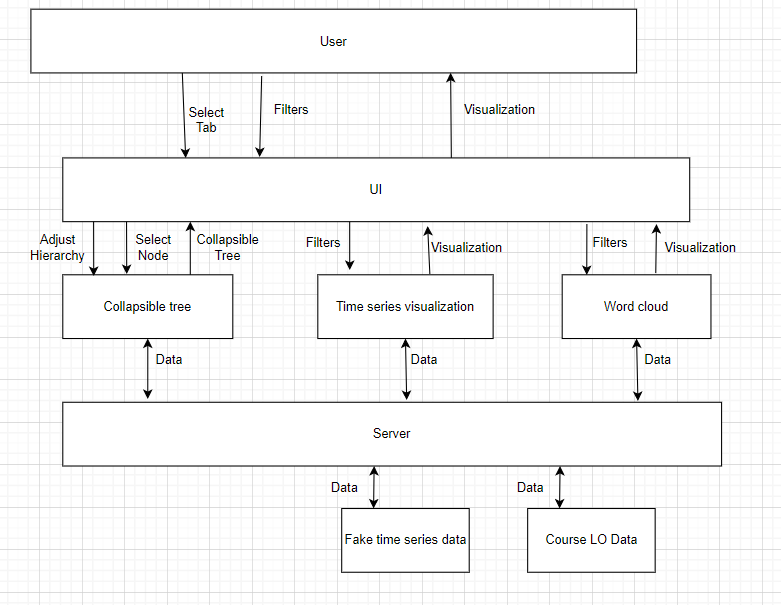
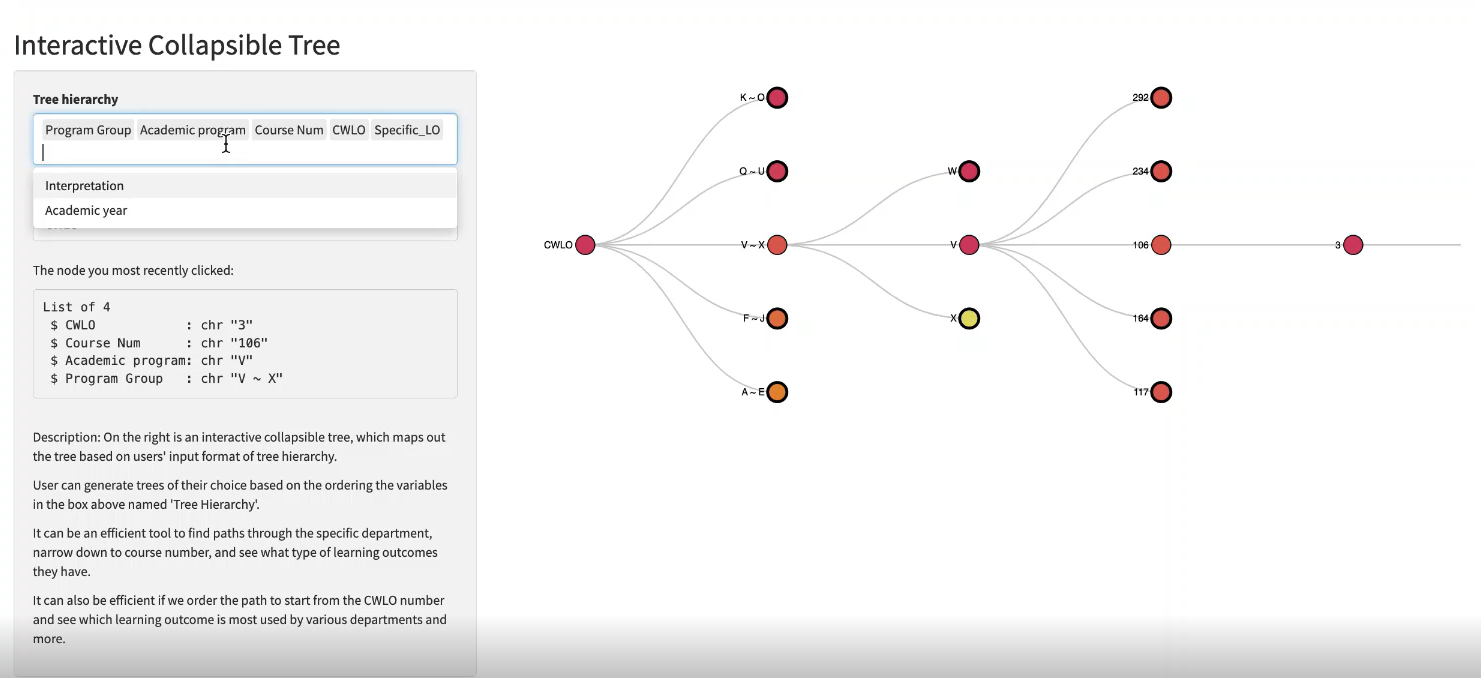
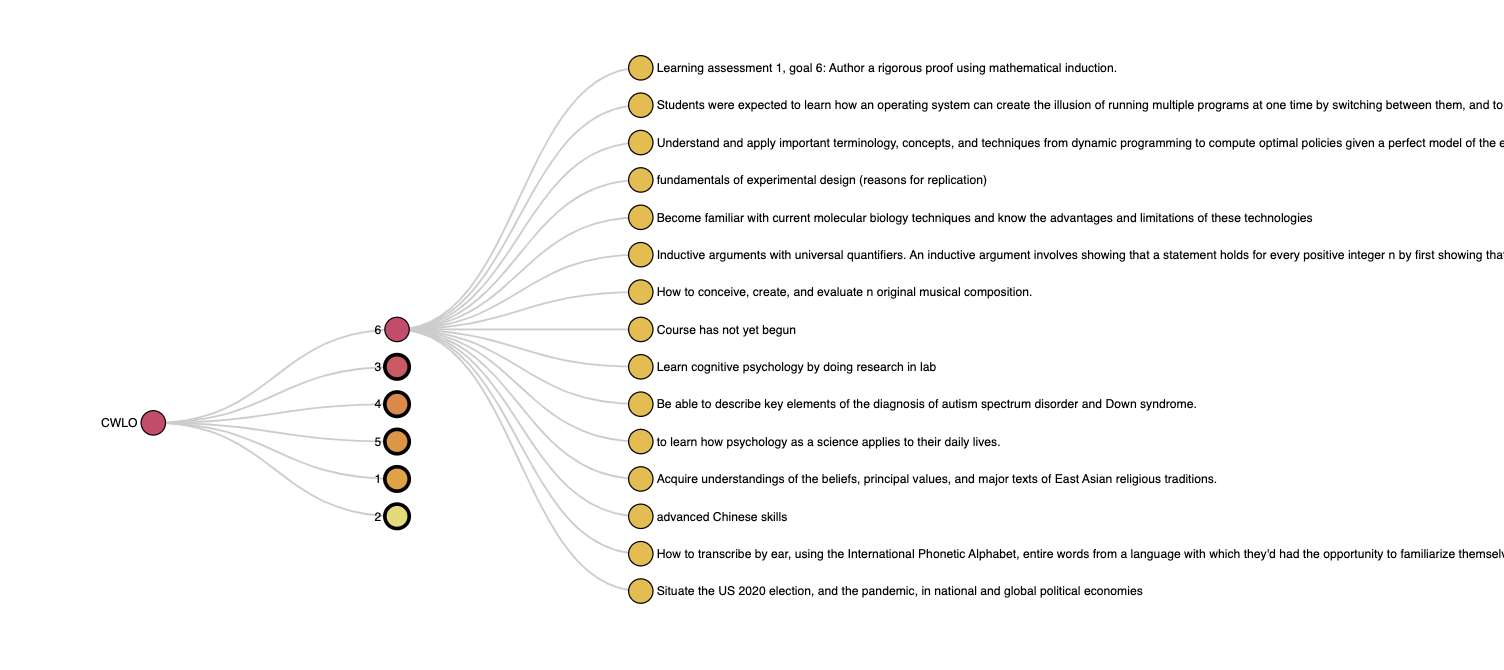
The second project was another data visualization project, but it was group based and we were working for a client based out of the Grinnell College Center for Teaching, Learning, and Assessment. We were given a dataset of anonymized survey answers from professors, and tasked with answering a series of questions about the data:
1) What is the level of student achievement of the learning outcomes over time? 2) What phases of the assessment process are departments engaged in?
3) Which learning outcomes are the most prevalent in Grinnell?